
By Michael Gonzales, PhD
An Analytic Ecosystem Inventory (AEI) helps organizations document and quantify their current analytics landscape. It collects metrics about analytic applications, supporting technologies, and data sources — offering a clear view of how analytics is implemented and consumed across the business.
Unlike general assessments that capture opinions from analytic users, the AEI focuses on quantitative insights. It measures the technologies, applications, and user communities that shape your organization’s analytic maturity.
What the Analytic Ecosystem Inventory Includes
The AEI framework typically covers four major components:
- Antecedents: Documentation related to analytics, corporate objectives, and standards.
- Applications: Analytic applications, their user base, and life stage.
- Technologies: Tools and platforms supporting analytic operations.
- Data: Information about data sources, size, type, and frequency of use.
To ensure consistency, it’s best to use a structured instrument — such as a spreadsheet — for gathering data. This enables accurate, repeatable collection even when multiple teams are involved.
1. Understanding Antecedents
Antecedents are formal documents used to evaluate the maturity of analytics in an organization.
For example, a business strategy that references analytics demonstrates that the enterprise recognizes data as a competitive advantage.
Below are key artifacts assessment teams should review when determining analytic maturity:
- Business strategy documents referencing analytics (can be redacted if necessary)
- Analytic strategy documentation
- Organization charts for analytics and data governance teams
- Analytic development and implementation standards
- Example of a requirements document for the analytic environment
- Example of a test plan for an implemented analytic application
- Example of a Service Level Agreement (SLA) with user communities
- Education curriculum or training offered by the analytics team
- Course evaluation forms used post-training
Gathering these documents requires minimal resources. Teams can request documents during the kickoff session, follow up with examples via email, and confirm titles shared by internal stakeholders.
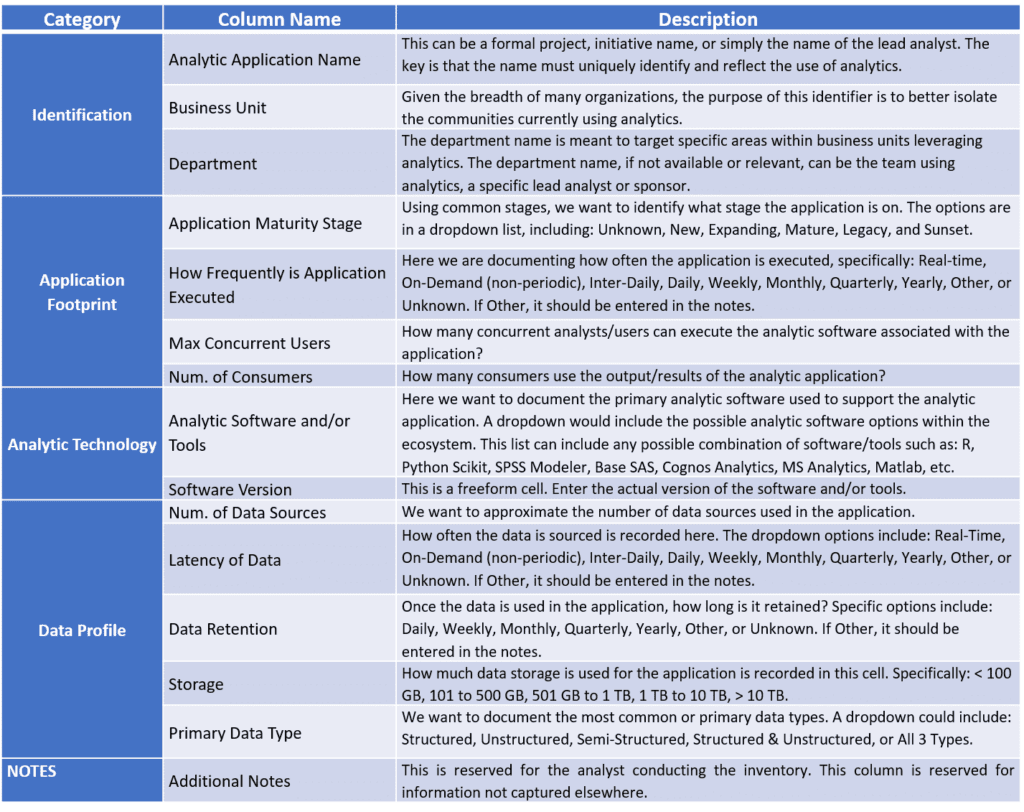
2. Technical, Data, and Application Examination
An Excel-based AEI spreadsheet helps structure and standardize information collection. It should include columns for:
- Technology licenses
- Data sources and size
- Supported user communities
- Applications built on each technology
Table 1: Architecture Inventory (not shown)
This format provides clarity when evaluating relationships among applications, technologies, and users.
3. Techniques for Analyzing the AEI
The AEI involves two primary areas of assessment:
- Formal antecedent documentation
- The inventory of analytic applications, supporting technology, and data
To gain accurate insights, teams should not analyze these areas in isolation. Instead, compare findings across information sources—such as surveys, interviews, and inventory data—to validate consistency.
For instance:
- If SMEs mention specific analytics technology standards, those should appear in the technology inventory.
- If SMEs claim there’s no formal training but the organization offers a structured curriculum, that discrepancy needs investigation.
Figure 1 – Overlapping Information Channels highlights how these data sources intersect.

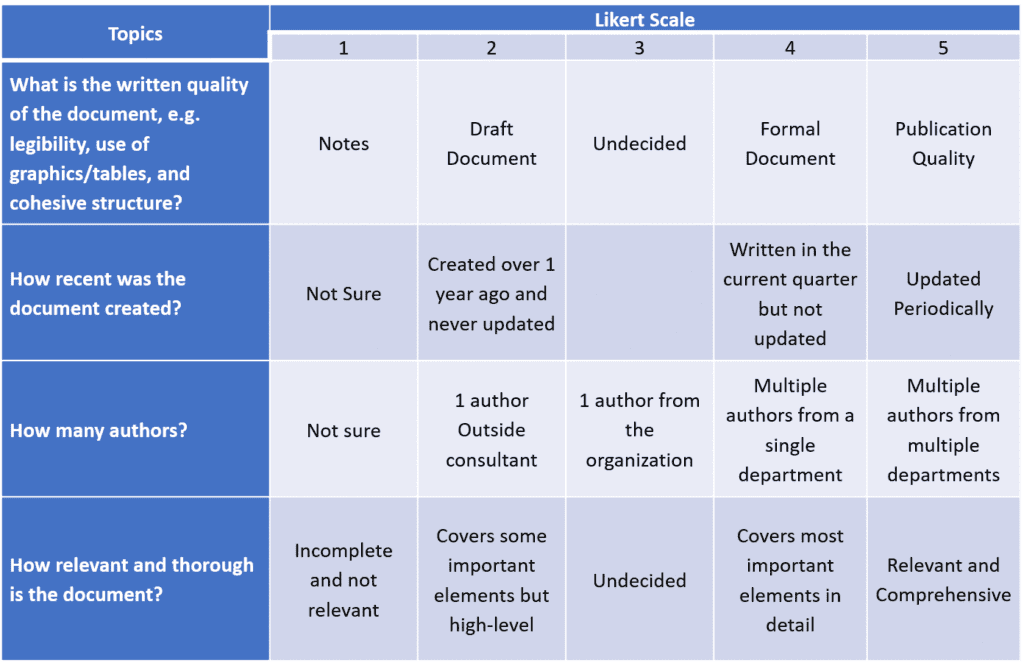
4. Analyzing Antecedents
To evaluate antecedent documents effectively, teams can:
- Review each document and provide observations.
- Use a Likert Scale to rate maturity factors.
This structured approach enhances repeatability and transparency, compared to subjective review methods.
(Refer to Table 2 – Assessing Antecedents for sample evaluation criteria.)
Table 2 – Assessing Antecedents
5. Analyzing the Inventory
The AEI offers valuable insights based on quantitative patterns. Analysts can use these patterns to answer key questions such as:
- Support for Standards – How consistent are the technologies supporting analytics? Are multiple versions in use?
- Application Maturity – Are applications mostly new, expanding, mature, or legacy?
- User Communities – Do these applications support broad user groups or niche teams?
- Departmental Concentration – Are analytic applications centralized or spread across departments?
- Data Latency – Is the data consumed in batches, real time, or on demand?
These findings help organizations identify gaps, improve efficiency, and enhance governance across their analytics landscape.
Conclusion
Conducting an Analytic Ecosystem Inventory provides organizations with a comprehensive snapshot of their analytic maturity. By documenting antecedents, technologies, applications, and data sources, teams can uncover improvement opportunities, align analytics with business goals, and support future scalability.
About the Author

Michael L. Gonzales, Ph.D., is an IT industry veteran with over 30 years of experience as a Chief Architect and Senior Solutions Strategist. He specializes in leveraging business analytics for competitive advantage in global enterprises.
His research and presentations have been featured at leading international conferences such as:
- Decision Sciences Institute
- Americas Conference on Information Systems
- Hawaii International Conference on Systems Science
Dr. Gonzales holds a Ph.D. in Information and Decision Science from the University of Texas.
He currently serves as Managing Partner at dss42, LLC, and Senior Data Scientist at Prolifics.


