Innovation Sandbox 1:6 – Tales from the Sandbox – The Impact of Innovation
Innovation is not just a word – it’s a necessity to surviving and achieving in the new normal. How are others How can you? Don’t miss the conversation!

Innovation is not just a word – it’s a necessity to surviving and achieving in the new normal. How are others How can you? Don’t miss the conversation!

Entity Resolution (ER) is an important tool used to address data issues, from the most serious – stopping international fraud – to the most basic – finding duplicate names in your customer list. Now, advancements in artificial intelligence and automation for ER make it more useful and valuable than ever.
Entity resolution is the analysis of multiple “entities,” which includes people, places, events and objects/assets, to determine how those items are – or are not – linked. The power of ER is to look at non-obvious connections within a data set and make those connections obvious. Jeff Jonas, CEO of Senzing, an artificial intelligence (AI) company focused on ER, puts it in simpler terms: “ER determines who is who and who is related to who in data.”
As a simple example from Senzing, here are different entity profiles housed in a company.
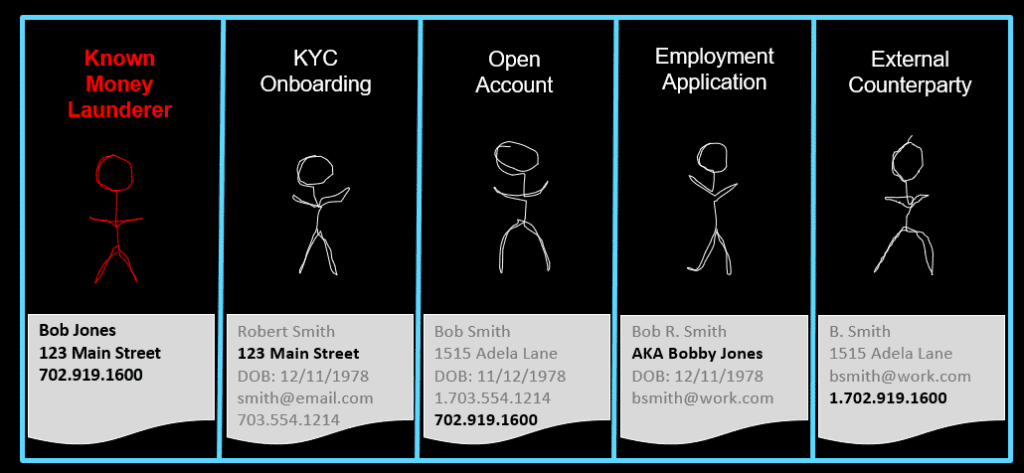
In this scenario, there could be anywhere from one to five separate entities. Entity resolution is important because it tries to create a single version of the “truth” for any given entity that the business deals with. Senzing Entity Resolution software uses “entity-centric learning,” a form of artificial intelligence, to make new judgments – and change previous resolutions – in real time, based on new information coming in or leaving.
Fraud – Bad guys are continually trying to get away with things, and they’re becoming more and more sophisticated with multiple false or misleading identities and the type of transactions they try to carry out. Most larger companies have fraud alerts, but what they don’t have is the time or manpower to analyze every alert, let alone find otherwise non-obvious connections with other data. ER software can be programmed for automatic entity resolution based on the number and types of attributes linked. The ER system then runs mock scenarios to see how outcomes would change under the resolution – helping to indicate if and where the fraud exists.
Data governance – Companies want clean, understandable data for a host of analytical purposes. For many types or organizations, the largest amount of data relates to customers. Customer data is often duplicated across and within many systems: transaction history, credit card info, loyalty programs and so on. ER gives companies a big step toward clean data and greater insight when it comes to “know your customer” (KYC). This makes for much more efficient and successful sales and marketing campaigns as well as generating a better overall customer experience. ER has the added benefit of saving money on data storage costs by eliminating multiple duplicate records.
CCPA/GDPR – California’s Consumer Privacy Act (CCPA) and EU’s General Data Protection Regulation (GDPR) and laws like them give individuals a level of control over how companies use their collected data. This includes what’s generally referred to as the “right to be forgotten” – having a company delete the requestor’s information as mandated by the applicable law. Hefty fines can be imposed for non-compliance. ER takes the request form and compares it against the company’s databases to connect related information into one record, which can then be deleted, all while providing an audit trail.
Other uses include ensuring regulatory compliance, applicant and vendor screening, and modernizing record and registration systems.
Prolifics has joined forces with Senzing to further Jeff Jonas’ goal of making high quality ER available to mainstream companies. Senzing offers a plug-and-play, real-time AI for ER desktop app and a more advanced API version for developers. Senzing’s ER is a type of middleware. Prolifics can provide the data solutions and services to prepare your data for ER, and the services and solutions to get the desired operational outcomes implemented after entity resolution. You don’t need a million-dollar-plus budget, expensive ER experts, or a large number of IT resources to deploy Senzing ER. Connect with Prolifics at solutions@prolifics.com.
For more information, watch Jeff Jonas’ visit to the Innovation Sandbox. And don’t miss his story about running a marathon with his mom!

Data Fabric and Data Lineage are two terms we see a lot – on websites, in blogs and technical papers – but what’s the relevance? What do we really need to understand about our data and its power?
Manta and Talend send their data experts to visit the Innovation Sandbox. Ernie Ostic (M) and Rolf Heimes (T) answer questions about data and explore its significance in today’s new normal – all delivered with a dose of their personal style and passion for the topic.
Watch now.

National Geographic named him the Wizard of Big Data. He works on innovation, national security and privacy with government leaders, think tanks and executives all over the world. And now, Jeff Jonas is talking with you from inside the Innovation Sandbox!

“The fabric of our lives.” We all know this as a phrase the cotton industry has used for years. But given the exponential flood of information we devour today, there’s really a new fabric that all organizations need to understand and live with – data fabric. And as that data fabric is weaved, it’s important to know where the data originated and how it flows – the data lineage.
Gartner ranked data fabric as a top 10 data and analytics trend for 2019.
The term “data fabric” has been around for a few years but has only recently gained more attention and traction. Leading research and advisory company Gartner had it as one of their “Top 10 Data and Analytics Technology Trends for 2019.”
Prolifics partner Talend, a leader in data integration and data integrity, knows a thing or two about data fabric. Last month, independent research firm Forrester named Talend “a leader in enterprise data fabric evaluation.” Talend describes data fabric this way:
Data lineage is describing where data came from (how it entered your organization), how it’s moved and spread through the organization, the data’s characteristics and how it’s changed, and its overall quality. Prolifics partner MANTA succinctly describes the importance of data lineage:
For MANTA, data lineage is more important than ever given today’s environment. When dealing with data privacy regulations, like the EU’s General Data Protection Regulation (GDPR) and California’s Consumer Privacy Act (CCPA), MANTA notes that “data governance (is) made possible with powerful data lineage…full lineage is a must when proving compliance with any data-oriented regulation.” When dealing with the unexpected, like remote workers in a pandemic lockdown, “…understanding of how your data flows and its transformations, you will easily come up with strategies to overcome the data-related obstacles that the current pandemic has caused for your organization.”
“Innovation Sandbox – Powered by Prolifics,” is a new, six-week YouTube Live series with today’s brightest minds, latest tech and most creative ideas.
Episode 2: “Take a Byte Out of Data,” airs live on Thursday, July 16, 10-10:30 a.m. ET on our YouTube channel, Prolifics TV. Rolf Heimes from Talend and Ernie Ostic from MANTA will discuss how companies that adopt new technologies, architectures, and methodologies for data will succeed – while companies that don’t will risk becoming obsolete. Learn more here Data Fabric and Data Lineage – The Basics.

The term “garbage in, garbage out” is as relevant to your data today as it was 20 years ago. If your company’s data is in chaos – incomplete, fragmented, trapped in siloes, hidden in legacy systems, poorly identifiable, duplicated – anything you try to do with that data will be, unfortunately, garbage.
The pandemic shutdown exposed or exacerbated problems with cost optimization, cost efficiency, business continuity and disaster recovery. As companies reopen and retool post-lockdown, it’s more important than ever that you have clean and complete data – everything starts with having a handle on your data. If it’s in chaos, it will hurt you.
It’s kind of a “Catch-22” scenario – your data situation is in chaos because of your legacy systems, but you don’t think you can move from the legacy systems because of how deeply ingrained your data is. But legacy systems cost more to maintain, things take longer, and opportunities are missed. Data is growing exponentially at a time when you need speed and efficiency – but that new data is going into chaos. Whether moving to the cloud or staying on-prem, it’s time for application modernization and integration. You don’t need to do it all at once – but you better start soon, or the drips will keep on coming.
The EU’s General Data Protection Regulation (GDPR) and California’s Consumer Privacy Act (CCPA) and laws like it give individuals a level of control over how companies use their collected data. This includes the “right to be forgotten” – a company must delete a requestor’s information in its systems as mandated. Fines can add up – in CCPA it’s $2,500 per compliance violation, going up to $7,500 if the violation is deemed intentional. If you don’t know what data matches to which customers, or all the nooks and crannies where that data is and how to get to it, the penalties could add up fast.
“Wizard of Data” Jeff Jonas defines entity resolution as “who is who and who is related to who” in data. The common terms identity resolution; record linking, matching and deduplication; and “merge-purge” are forms of ER. Entity resolution means you have a single version of something that your business must deal with, like a customer or a vendor, or you understand the relationship between somethings, like which salesman belongs with which vendor. If your data is garbage, and entity resolution is difficult, you’re setting yourself up for problems from bad customer experiences and cost inefficiencies to outright fraud.
Companies today are using artificial intelligence and machine learning (AI/ML) tools to automatically detect sophisticated data patterns to predict potential outcomes, giving them better decision-making insight and abilities. For example, a financial organization using AI/ML can analyze its entire historical loan portfolio on an ongoing basis, learning and recognizing patterns of factors in real time that lead to a much higher rate of default. If a new loan application has those factors, the AI/ML program would flag it for denial. AI/ML is for “what’s next” questions, like which current customers will likely buy your new product or when will a piece of equipment break down. These insights can have you crushing your competition – unless your data is in chaos. Then the competition will be crushing you.
Prolifics experts can help you with your data, systems modernization and integration, and cloud and hybrid cloud platforms. Visit www.prolifics.com or email solutions@prolifics.com.
Join data experts Brian Kordelski (Prolifics) and Rolf Heimes (Talend) for a discussion on how companies are striving to be leaner and more efficient when it comes to housing and managing data. They’ll also look at how migrating to an opensource framework can be cost-effective and quickly deployed. More information and registration here 4 Ways Your Data Chaos Will Hurt You.

We’re in the era of data – tsunamis of data, in fact, that are growing exponentially. With it comes concerns about what we can learn from the data – separating the melody from the noise – as well as overcoming worries surrounding privacy and fraud. Entity resolution (ER) is an important tool used to address these data issues.
On the cutting edge of ER technology is Jeff Jonas, CEO and Chief Scientist for Senzing, Inc., an artificial intelligence‐based (AI) software company focused on ER.
In the book “Entity Resolution and Information Quality,” writer Terry Talley states:
Entity resolution is the process of probabilistically identifying some real thing based upon a set of possibly ambiguous clues. Humans have been performing entity resolution throughout history. Early humans looked at footprints and tried to match that clue to the animals that made the tracks.
In the same book, writer John R. Talburt gives it a more formal, scientific view:
Entity resolution is about determining when references to real-world entities are equivalent (refer to the same entity) or not equivalent (refer to different entities). Linking is appending a common identifier to reference instances to denote the decision that they are equivalent.
Other related terms include identity resolution, record linking, record matching, record deduplication, merge-purge, and entity analytics, all of which represent particular forms or aspects of ER.
Jeff Jonas gives ER a simpler and more understandable definition:
ER determines “who is who and who is related to who” in data.
Entity resolution is important to a business because it helps create a single version of the “truth” for any given entity that the business deals with.
Many companies can relate to the idea of a single customer view. Multiple systems may store separate pieces of information — purchase history, demographics, credit info, loyalty programs, and more — for the same person.
Example:
If your systems send an email blast to K. Coggs, KT Coggs, Katie Coggs, and Kathryn Coggs — are they one annoyed customer receiving four emails or four separate people?
Having a single, unified customer view improves data accuracy for advanced and predictive analytics. Without it, you might send the wrong offer or communication — for example, sending Katie Coggs’ product recommendation to her mother, Kathryn.
ER also plays a vital role in fraud detection — such as when multiple people use the same assets as loan collateral at different branches.
In addition, ER supports compliance with data privacy laws like the EU’s GDPR and California’s CCPA, which grant individuals control over their data — including the “right to be forgotten.”
For example, if KT Coggs requests deletion of her data, failure to recognize that K. Coggs and KT Coggs are the same person could lead to non-compliance fines.
Jeff Jonas addresses all these ER challenges and more as CEO and Chief Scientist at Senzing, Inc. His work ranges from identifying duplicate contacts to uncovering criminal identities in real time across thousands of data sources.
The nickname “Wizard of Big Data” originated from a 2014 National Geographic article that profiled his innovative ER work. Some of his high-profile cases include:
As National Geographic described, Jonas’ systems use only legally obtained data and include privacy safeguards. They connect data points — such as addresses, job applications, and loyalty program details — to detect hidden links between people.
Jonas’ goal is to make high-quality ER technology available to mainstream businesses. Senzing offers both a plug-and-play real-time ER desktop app and an advanced API for developers — removing the need for million-dollar budgets or large IT teams.
Jonas continues to collaborate with government leaders, think tanks, and global executives on innovation, national security, and privacy. He holds over a dozen patents and is one of only five people in the world who have completed every Ironman triathlon currently on the global circuit.

Jeff Jonas will be the first guest for the inaugural season of “Innovation Sandbox, Powered by Prolifics,” a new YouTube Live series featuring today’s brightest minds, latest technologies, and creative ideas.
📅 Date: Thursday, July 9
🕙 Time: 10–10:30 a.m. ET
📺 Where: Prolifics TV
The episode, “We’re LIVE to see the Wizard!”, will be hosted by Greg Hodgkinson, Prolifics’ CTO and Innovation Center leader.
Join us for a dynamic discussion on how entity resolution impacts everyday life, plus insights from Jonas on innovation, AI, and even Ironman training during a pandemic.

Data privacy laws and regulations, like the EU’s General Data Protection Regulation (GDPR) and California’s Consumer Privacy Act (CCPA), are just getting started. That means more customers will control how companies use their collected data. Understandably, companies are struggling to understand and comply with these new laws.
The American Bureau of Shipping (ABS) collects a substantial amount of data from customers and business partners through its operations in 70 countries. ABS needed to understand what laws applied to them and how best to move toward compliance. But, instead of waiting for each government mandate to roll out, ABS needed a bigger picture solution – one that was applicable, repeatable and would address a large percentage of whatever government data privacy rules come next. ABS also needed the solution to help distinguish its brand in the marketplace as being a good steward of its customers’ data.
ABS is one of the world’s leading ship classification organizations, committed to setting standards for safety and excellence so that the marine and offshore industries can operate safely, securely and responsibly. For more than 150 years, ABS has worked alongside its partners to tackle the most pressing technical, operational and regulatory challenges.
Prolifics provided data integration and data management solutions that helped ABS modernize data delivery and data consolidation for its 200 offices around the world.
We first worked with ABS to deploy our rapid Data Privacy Assessment, to identify issues and opportunities for data integration and a larger data solution for continuity.
We then introduced Prolifics’ Data Governance Framework solution, to give ABS a unified platform to deliver data governance, analytics and compliance on a global scale. The Data Governance Framework centralizes both structured and unstructured data from across ABS, so that the company can gain a more complete understanding of the information it owns and act on regulatory requests. With this insight, the company can target sensitive data for action, move toward better compliance, and avoid regulatory infractions that impact both the bottom line and the brand’s image.
As a result of the Data Governance Framework solution, ABS is closer to compliance with GDPR, CCPA, and other regulations as they emerge.
The solution provides ABS with extensive cost savings in infrastructure capital expenditure in the first three years by centralizing onto a single platform. ABS expects a 10 percent improvement in service utilization, with a projected revenue growth of 20 percent over the next three years.
A foundation of reputable, high-quality data prepares ABS to adopt cutting-edge technologies that leverage artificial intelligence and machine learning (AI/ML) to drive innovation. Potential use cases include regular, automated data remediation and risk reporting, as well as larger AI/ML-powered initiatives across the business.
Closer compliance with GDPR and CCPA
10% service utilization improvement
AI/ML-powered use cases
ABS used the Data Governance Framework solution to:
The Data Governance Framework solution brings together a number of Prolifics and IBM technologies to create a unique capability. Our combination of software, integration, governance framework, and forward-looking focus on innovation enables the Data Governance Framework solution to understand and respond to data problems as a whole – creating compelling long-term value for the client.
Specific technologies implemented with ABS included:
Using these technologies, Prolifics provided ABS:
At Prolifics, we provide end-to-end data analytics services, at any point you want them, for whatever condition your data is in. Visit our Data & Analytics services page or email us at solutions@prolifics.com.

Around the country, sweeping data privacy regulations are compelling businesses to rethink every aspect of their data governance capabilities.
If your organization complied with General Data Protection Regulation (GDPR) standards set by the European Union in 2016, you may have a head start. However, compliance with the GDPR will not be sufficient for compliance with the new state regulations. If your data lifecycle management process hasn’t changed in recent years—or if you never had a holistic, company-wide process to begin with — it’s time to stop kicking that can down the road.
Our new infographic shows you how three states are changing their data privacy landscape. You’ll also see steps your company can take to avoid unexpected penalties in the future.

The United States does not yet have a comprehensive federal-level privacy law that reaches the scope of the GDPR in the European Union. Still, there are several vertically focused federal laws that businesses must be aware of if they deal with private consumer data. These include:
Your organization’s data quality and data governance team should discuss your approach tomanaging data assets. A methodical approach to making sure your organization is compliant will involve the following process:

Do you do business with anyone who’s considered a legal resident of California … and do you hold data on California customers that’s categorized as
Being compliant requires a controlled methodology and industry-leading solutions to ensure your company is able to comply with the CCPA mandate both now and in the future. Prolifics’ CCPA Jump Start can get you on the right track.